In this article, you’ll explore the essential marketing KPIs (key performance indicators) that you must track in every stage of a customer lifecycle journey to drive performance.
The 6 Stages Of A Customer Lifecycle Journey
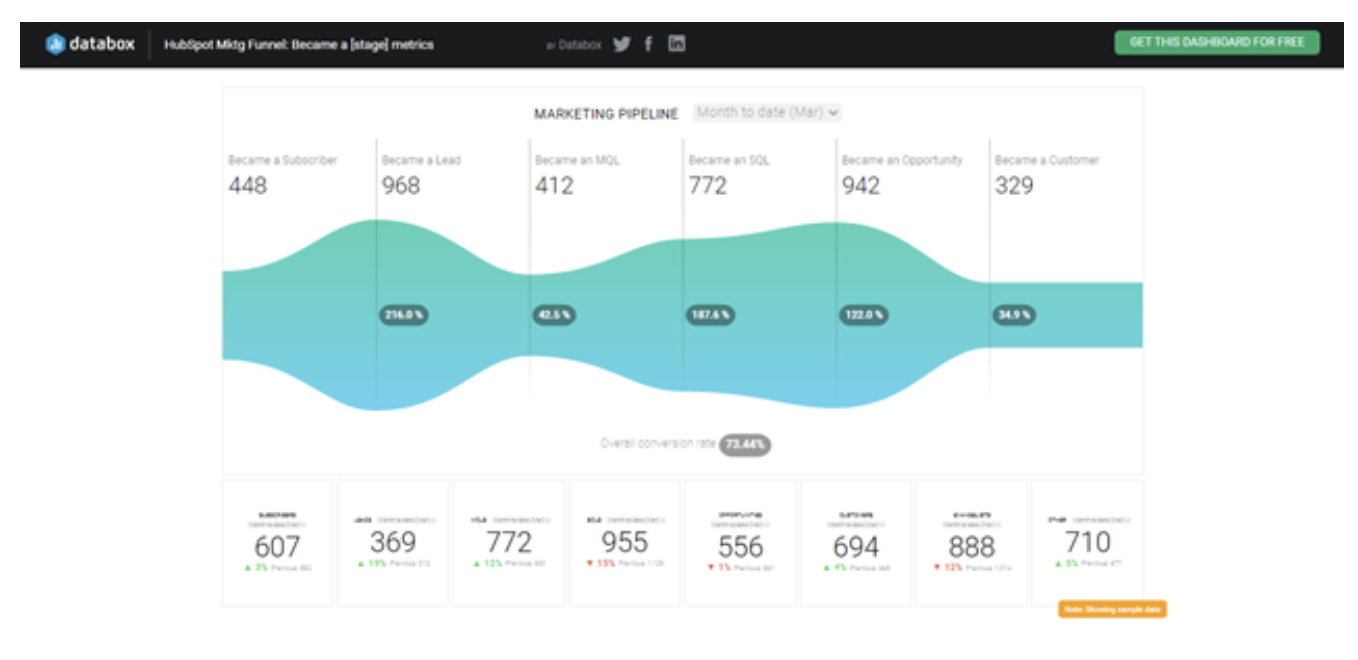
Example of a Marketing Pipeline Dashboard in HubSpot
A Customer Lifecycle Journey can be divided into the following 6 stages.
Stage 1: Subscriber
The first stage is when a person becomes your subscriber. They contact you to know more about your product/service or seek more information about your business.
What KPIs should you measure at this stage?
Consider tracking these two KPIs:
1. Visitors to subscribers conversion rate
It shows how many people visiting your website subscribed to your site.
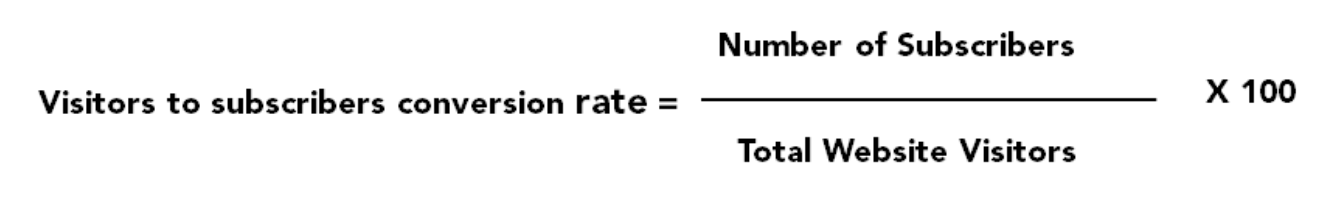
For example, if your website had 15,000 visitors and 2,000 subscriptions last month, your conversion rate is 13.33%.
2. Average monthly sessions
It shows the average number of times your site was accessed per month. It’s important to track this KPI because the more your website is viewed, the more chances you have to get subscribers.
Stage 2: Lead
During the second stage, your subscribers become your leads who are contacts that have shown willingness to buy your product/service.
Many companies define a lead as a contact that expresses interest by sharing contact information, such as an email ID, a phone number, or even a social media handle.
However, unlike a subscriber, your lead shows more interest in whatever you are selling by signing up for a content offer from your business.
What KPIs should you measure at this stage?
There are two KPIs you’ll want to track in this phase.
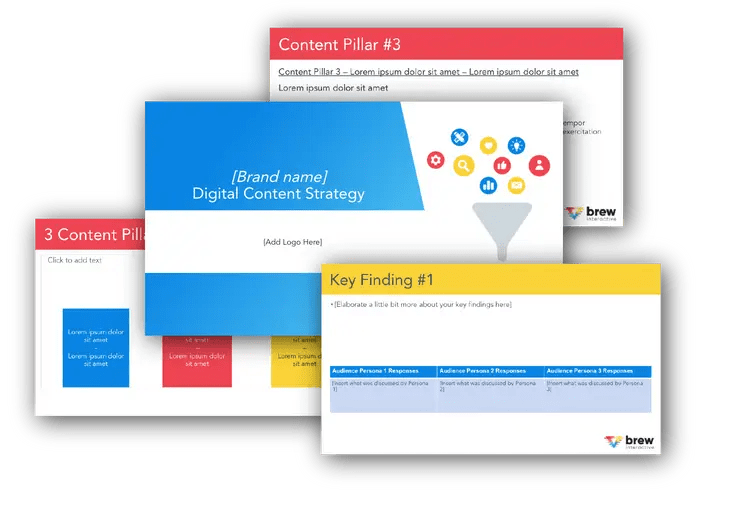
Free B2B Content Strategy Template
Not sure where to start when it comes to your content strategy? Struggling to gain traction? Grab our free B2B content strategy template to help you document your strategy.
3. Subscribers to leads conversion rate
It helps you track how many of your website subscribers turn into leads. It’s important to track this KPI if you want to know how effective your lead nurturing efforts are.
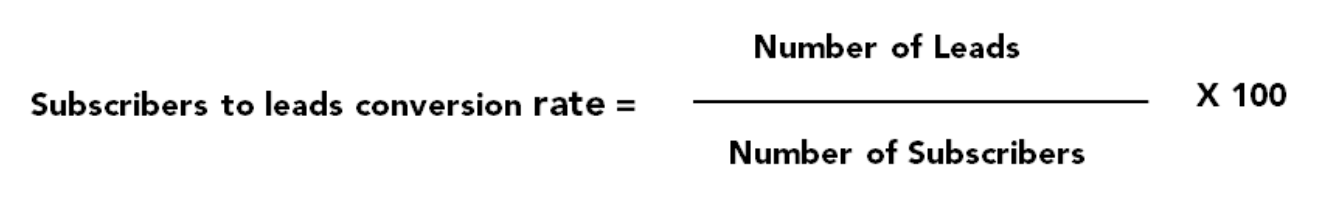
Suppose out of your 2,000 subscribers 500 turned into leads, then this rate would be 25%.
4. Number of new prospects
It helps you know how many people become your leads from sources other than your site, such as your social media or Google ads.
How do you measure KPIs in Stages 1 & 2?
You can measure KPIs in both these stages using Google Analytics. For instance, to track the average number of sessions, check out the ‘Audience Overview’ tab as shown below.
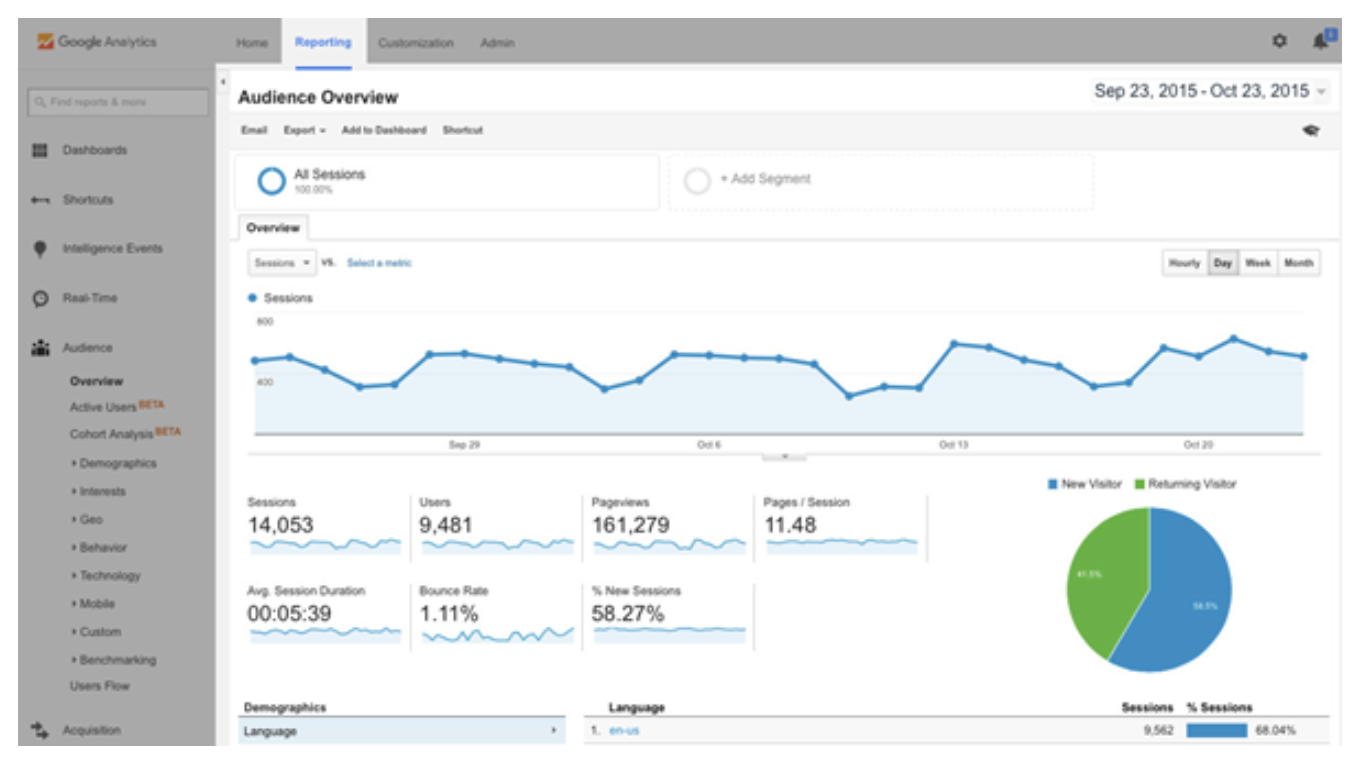
Example of Google Analytics Dashboard Showing Number of Sessions
Plus, you can view sources and referrals, as well as set up event and goal tracking to see the number of new prospects.
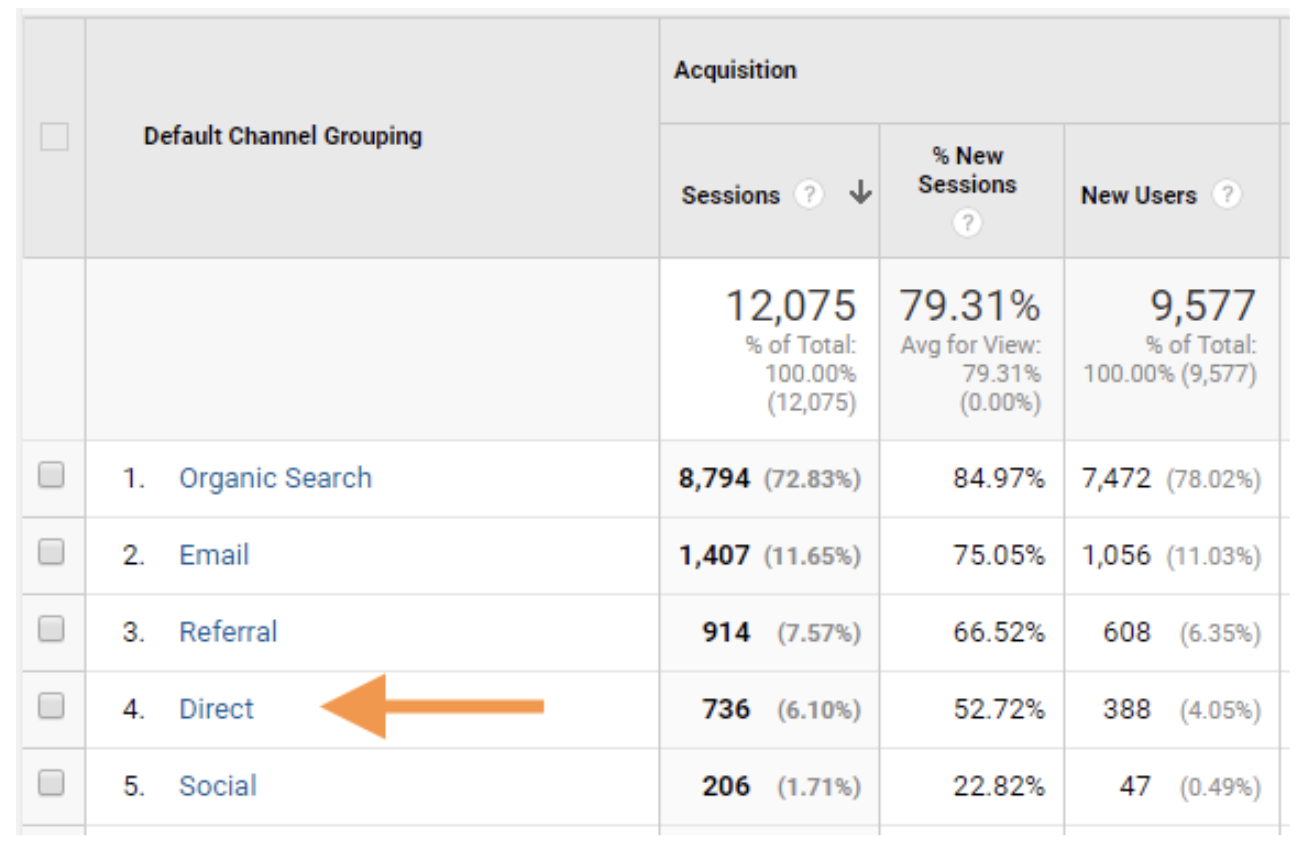
Google Analytics dashboard showing new users from different channels
Stage 3: Marketing Qualified Lead (MQL)
The third stage specifies your contacts who have engaged with your marketing efforts but are still not ready to receive a sales call. For example, a lead responding to a specific form in your marketing campaign.
MQL actions may include: filling out online forms, frequent visits to your website, signing up for a webinar or a trial, adding items to their carts, attending software demos, and so on.
What KPIs should you measure at this stage?
During this stage, consider tracking:
5. Click-through rate (CTR) on emails and downloadable content
It shows how many people clicked on the emails or other digital content developed by your marketing team. It’s important to calculate this KPI because it shows how much engagement your marketing materials get. A high CTR indicates that your marketing efforts are effective.
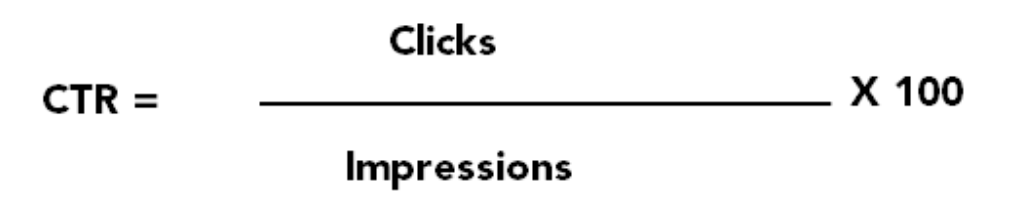
Suppose you sent a marketing email to 1,000 contacts but only 400 of them clicked on the link within your email, then your CTR will be 40%.
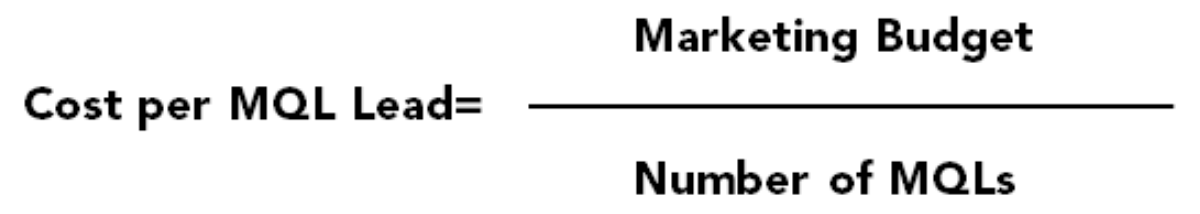
6. Cost per MQL lead
This KPI shows how much cost you incurred in acquiring one MQL Lead. It helps you gauge the effectiveness of your marketing efforts in terms of costs.
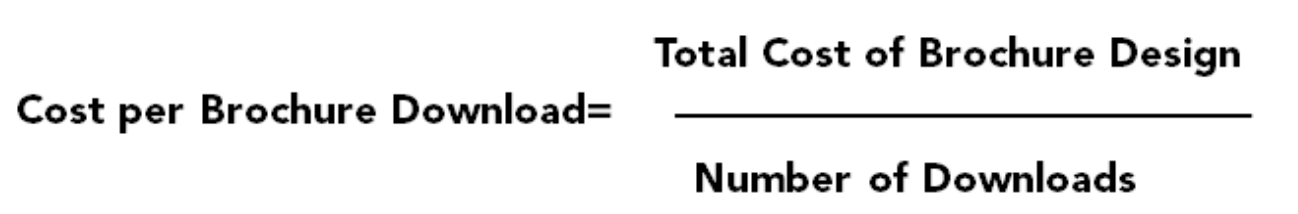
7. Cost per brochure download
It helps you calculate the cost incurred for every brochure (or other marketing material) download. Having a low cost per brochure download indicates that your marketing brochure was downloaded a higher number of times (which means more MQLs).
Stage 4: Sales Qualified Lead (SQL)
Your SQLs are the contacts that have indicated through their actions that they are ready for a direct sales follow up. For example, a lead submitting a question about your product via a contact form.
What KPIs should you measure at this stage?
At this stage, consider tracking:
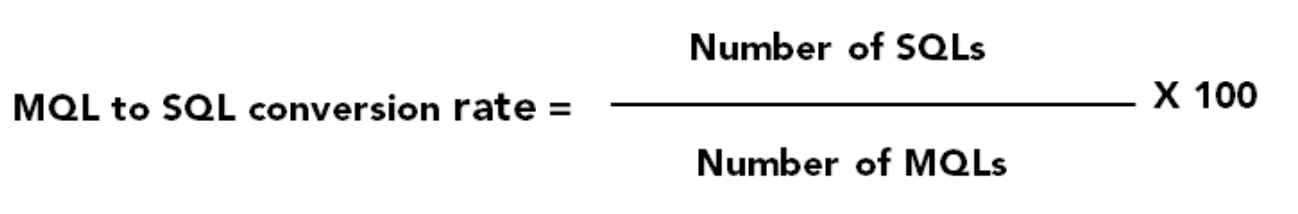
8. MQL to SQL conversion rate
It shows the percentage of MQLs that get converted to SQLs. A higher value of this rate shows that more of your leads are now interested in the purchase and can be followed by your sales team.
9. Lead score
Each lead that comes in should have their own numerical score indicating their position in the buyer’s journey. The higher the score, the closer they are to purchasing.
When a lead performs a certain action (such as clicking through on a marketing email, signing up for a webinar, or requesting a demo) add a certain amount of points to their score. And once they reach a certain score (indicating a high level of interest in your business) they then become an SQL and are passed over to the sales team.
Stage 5: Opportunity
At the fifth stage, your SQLs turn into contacts with real sales opportunities. For example, contacts having a discovery meeting and requesting a proposal.
What KPIs should you measure at this stage?
At this stage, you should track:
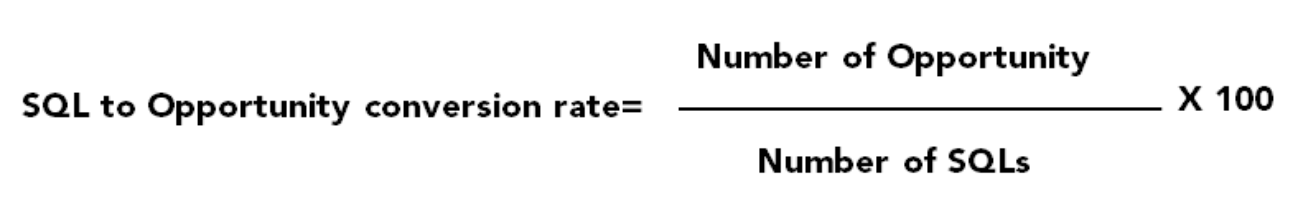
10. SQL to Opportunity conversion rate
It measures the percentage of SQLs that turn into real sales opportunities. It’s important to track this KPI because it indicates how many of your leads are now ready for purchase.
Stage 6: Customer
The last stage is when a lead turns into a contact with a closed deal and becomes a paying customer.
What KPIs should you measure at this stage?
In this phase, consider tracking:
11. Cost per acquisition (CPA)
It measures the aggregate cost to acquire one paying customer, and helps you determine the cost-effectiveness of your campaign.
For example, suppose you run a paid ad campaign for your business with a total budget of $500. After the campaign ended, you calculate that it resulted in 25 sales. So your CPA would be $20.
How do you measure KPIs in Stages 3 to 6?
Most marketing automation tools like Salesforce Pardot or HubSpot offer built-in MQL and SQL reporting that helps you identify which leads are more likely to convert into customers. But in most cases, your contacts marked as Opportunity are opted out of all automation and your sales team will manually deal with the lead at this point.
The Bottom Line
Understanding these 6 customer lifecycle stages and knowing what KPIs to track during each stage are critical so that you can focus less on what each stage is and more on moving your leads through the funnel.
Here’s a table to quickly summarize all the 11 KPIs:
| Customer Lifecycle Stage | What KPIs Should You Measure? |
| Stage 1: Subscriber |
|
| Stage 2: Lead |
|
| Stage 3: MQL |
|
| Stage 4: SQL |
|
| Stage 5: Opportunity |
|
| Stage 6: Customer |
|
Free DataStudio Marketing Report
Improve your marketing reporting with our free DataStudio template that pulls data from Analytics, Google Ads, and Search Console to get a 360 degree view of your digital performance.